We know what quadratic equations are. Now we're going to graph them. That's just how we roll. Whenever we find out what the Mega Millions lottery numbers are, we graph those, too. Same goes for basketball scores, election results, and opening weekend movie grosses. We might have a problem.
In order to get functions, we'll graph quadratic equations of the form
y = ax2 + bx + c.
This will ensure that we only have one value of y for each value of x.
Sample Problem
Graph the equation y = x2.
This is the simplest quadratic equation there is. It's also a relation, so we already know how to graph it. We may have forgotten it, but the knowledge is in there somewhere.
First we make a table of values so we can graph some points, and then we see the shape we're getting and connect the dots. Here's a sampling of points:

Now let's graph 'em:

This is forming a sort of "U'' shape, so that's how we connect the dots:

The only root of the polynomial x2 is x = 0. Therefore, 0 is the only value of x we can plug into the equation y = x2 if we want to get 0 for y. Un-coincidentally, the only point on the graph of y = x2 with a y-coordinate of 0 is the point (0, 0).
Once again, an appearance by the ever-popular 0. That guy is everywhere lately. He must be promoting a new film.
Let's do some slightly more interesting, though more complicated, examples. Of course, we could just graph these on the calculator, but we'd like to understand why we're getting the pictures we're getting. So unless you have one of those calculators that blabs on and on about how it "got there, " let's go ahead and do the work ourselves.
Sometimes we'll be asked to sketch a graph. Don't stress; no points will be taken off for less-than-perfectly-straight lines or a complete lack of artistic ability. The idea is to draw the rough shape of the graph and label a couple of easy values, but not to worry about pinpoint accuracy. Save the pinpoint accuracy for archery practice.
Sample Problem
Without using a calculator, sketch a graph of the function y = x2 + 1.
Honestly, when we graph y = x2 + 1, we get the graph of y = x2 moved up by 1 unit. The only value we need to label on the sketch is y = 1.

The examples we've done so far have been pretty straightforward, but now we'll get into some examples that are straightbackward. The graphs in our prior examples looked like the graph of x2 moved up or down a bit. To graph general quadratic equations, however, we need to do things differently.
We need a few new definitions first, so spread open your mind and clear some room...
The graph of any quadratic equation is a parabola. A parabola will look like either a right-side-up "U'':

...or an upside-down "U'':

The places the parabola crosses the x-axis are called the x-intercepts, just like with linear equations. The place the parabola crosses the y-axis is the y-intercept. The lowest or highest point of the parabola, depending on which way it opens, is called the vertex of the parabola. Not a vortex, so no need to worry about being swallowed up into a whirling, tornado-like spiral...unless you live in Kansas.
In order to sketch the graph of a general quadratic equation, we need to know three things.
- The intercepts
- The vertex
- Whether the graph opens upwards ("U'') or downwards (upside-down "U'')
Let's walk through an example to see how to find all these things, and how to put them together into a graph. This will be a nice, relaxing walk. You can even do it sitting down; that's how relaxing it is.
Sample Problem
Sketch a graph of y = x2 + 3x + 2.
We need to find the intercepts, the vertex, and whether the parabola opens upwards or downwards. We should also find out how late it's going to be open, in case we need to make a late night run.
1. Where does the parabola cross the axes?
First, where does the parabola cross the x-axis? An x-intercept is a point of the form (something, 0).
Therefore, the x-intercepts of our graph will occur at whatever values of x make y zero; in other words, at the roots of the polynomial x2 + 3x + 2. To find the roots, we factor the polynomial, set it equal to zero, and solve for x.
x2 + 3x + 2 = 0
(x + 2)(x + 1) = 0
x = -2, x = -1
These are the roots of the polynomial, and as a bonus, they're also the x-intercepts of the parabola. It's not a problem that they're both negative. This is an equal opportunity graph.
We now know the points (-2, 0) and (-1, 0) are on the graph:

Where does the parabola cross the y-axis? To find the y-intercept, we plug in 0 for x and see what we get. In this case, we find:
y = (0)2 + 3(0) + 2 = 2
So the y-intercept is 2. We also have the point (0, 2) on the graph:

We now have two points. If this were the NFL, that'd be a safety.
2. What is the vertex?
The vertex of a parabola occurs halfway between the roots, at least when the roots exist. We'll worry in a moment about what happens when they don't. Well, you can worry about it now, but please keep it to yourself until we get to it. No good can come of spoiling it for everyone else in the meantime.
For this parabola, then, the vertex occurs when x is halfway between -2 and -1, or at  . We find the y-value by plugging
  into the quadratic equation:

Nice. The point  is also on our parabola.

3. Does the graph open up or down?
Ever tried to push a "pull" door? Because we, um, haven't. It's important to know which way things open. A parabola is no different.
When x is outside the x-intercepts, the further away x gets from zero, the larger y gets, and it's not even taking growth hormones. When x = 5, y = 42; when x = 100, y = 10,302. We can imagine that if we graphed more points, we'd see the graph opening upwards.
Putting all the pieces together, we connect our dots in a "U'' shape, like this:

Now that we've gone through a sample problem and you enjoyed it so much that your mouth is in the shape of an upward-opening parabola, let's talk a little more about the sub-problems involved in graphing a quadratic equation of the form y = ax2 + bx + c.
1. Finding the intercepts.
There are two steps here: finding the x-intercepts and finding the y-intercept. It's like that Easter egg hunt all over again. The x-intercepts are the values of x that make y zero. In other words, the solutions to the quadratic equation
0 = ax2 + bx + c.
This may involve using the quadratic formula. Since not all quadratic equations have solutions, the graph might not have any x-intercepts. It could look like this, for example:

The y-intercept is the value we get when we plug x = 0 in to the equation ax2 + bx + c. When we do that, we find
a(0)2 + b(0) + c = c.
So the y-intercept is just y = c. A parabola will always have a y-intercept, since c will always be some number (possibly 0). With all of this up-in-the-air x-intercept business, it's nice to know we can still rely on c and the y-intercept. They'll stay with us through thick and thin.
2. Finding the vertex.
When a parabola has x-intercepts, the vertex shows up halfway between them. The number halfway between two numbers is also known as their average. Just like how you're halfway between the ages of your older brother and younger sister, which makes you totally average. Wait...
The average of 4 and 10 is  , which is the number halfway between 4 and 10. If we use the quadratic formula to find the x-intercepts, we get the values
 .
.
The number halfway between these two values is

This means the vertex occurs at  .
.
But wait, what happens when the quadratic formula doesn't get us any solutions? Sneakily enough, the vertex would still be at  . The value
  will always exist, because if a = 0 we don't have a quadratic formula in the first place. Oh, algebra. Always trying to slip one past us. Not this time, pal.
3. Deciding whether the graph opens upwards ("U'') or downwards (upside-down "U'').
The coefficient a on the x2 term tells us whether the graph opens upward or downward. If a is positive, the graph opens upward. If a is negative, the graph opens downward. This should be easy to remember, because when you have a positive attitude your mouth forms a "U" shape, but when you're being negative it forms an upside-down "U" shape. Unless you're one of those people who can remain completely straight-faced at all times, in which case you're on your own with this one.
Anyway, the reason for this is that as x gets farther from 0, y will be getting more and more negative.
Example 1
Graph the equation y = x2 + 2. |
Example 2
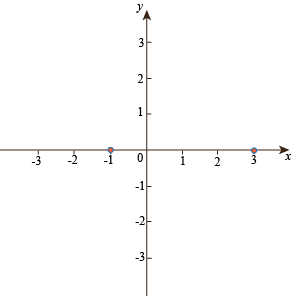
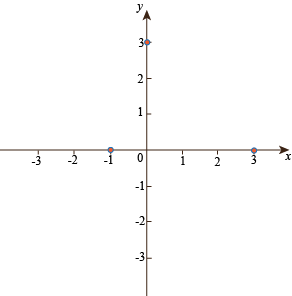
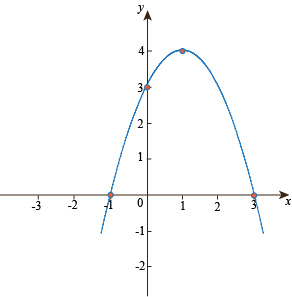
Graph the quadratic equation y = -x2 + 2x + 3. |
Example 3
Graph the quadratic equation y = 3x2 + x – 3. |
Exercise 1
Sketch a graph of the following: y = x2 – 1.
Exercise 2
Sketch a graph of the following: y = x2 + 3.
Exercise 3
Sketch a graph of the following: y = -x2 + 3.
Exercise 4
Sketch a graph of the following: y = -x2 – 1.
Exercise 5
For the following graph of a quadratic polynomial, find the roots of the polynomial, if any exist.

Exercise 6
For the following graph of a quadratic polynomial, find the roots of the polynomial, if any exist.

Exercise 7
For the following graph of a quadratic polynomial, find the roots of the polynomial, if any exist.

Exercise 8
For the following graph of a quadratic polynomial, find the roots of the polynomial, if any exist.


 , which in this case is
  .
. back into the equation, we find
 .
.


