ShmoopTube
Where Monty Python meets your 10th grade teacher.
Search Thousands of Shmoop Videos
Science Videos 45 videos
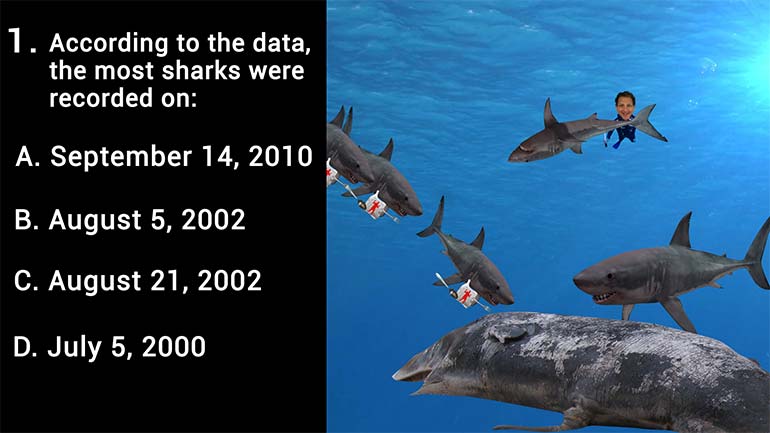
According to the data, the most sharks were recorded on:
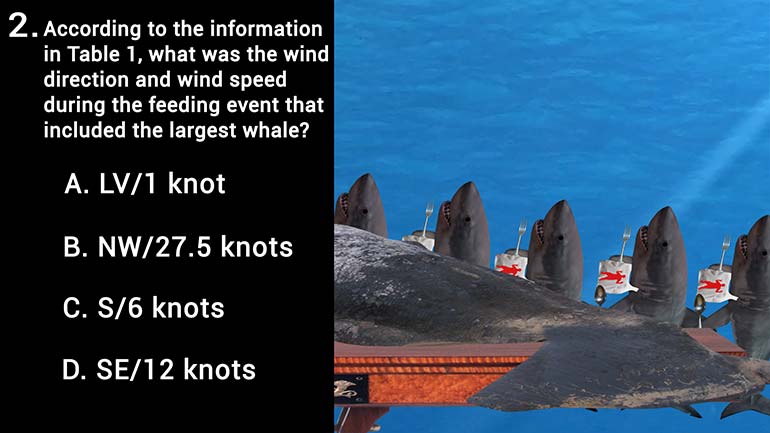
According to the information in Table 1, what was the wind direction and wind speed during the feeding event that included the largest whale?
Based on Table 1, which wind direction had the highest total number of sharks?
ACT Aspire Science: Changing the Thermometer Distance 0 Views
Share It!
Description:
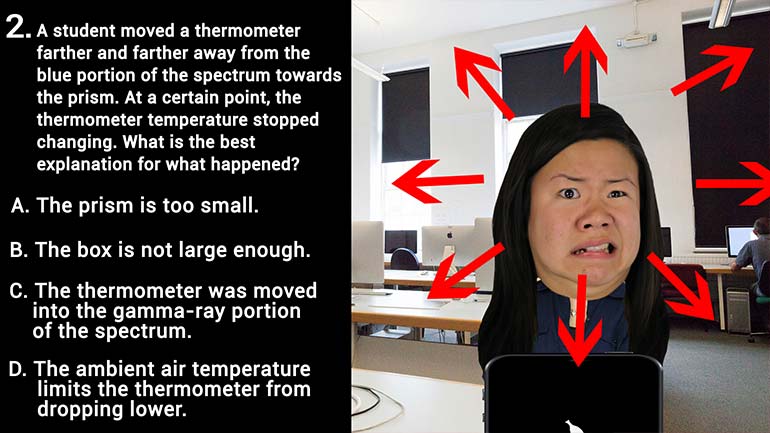
A student moved a thermometer farther and farther away from the blue portion of the spectrum towards the prism. At a certain point, the thermometer temperature stopped changing. What is the best explanation for what happened?
Transcript
- 00:00
Yeah Oh Okay Sign Shmoop er's next question For a
- 00:07
year ago a student moved a thermometer farther and farther
- 00:11
away from the blue portion of the spectrum towards the
- 00:15
prism Well at a certain point the thermometer temperature's stopped
- 00:19
changing What's the best explanation for what happened Did time
Full Transcript
- 00:24
stands still Okay Well think about it While light is
- 00:29
indeed influencing the temperature of the thermometer in this spectrum
- 00:33
that's projected by the prism there will the air surrounding
- 00:37
the thermometer also influences the thermometer riding same temperature Well
- 00:42
anything that has a temperature including air emits infrared radiation
- 00:47
So as you're reading this you're actually emitting a type
- 00:51
of light Always knew you would shine right Answer here
- 00:54
It's the ambient air temperature limits the thermometer from dropping
- 01:00
lower You know like the ocean is keeps everything kind
- 01:03
of temperate around the coast All right That's it Yeah 00:01:07.75 --> [endTime] Sort of That vibe anyway
Related Videos
According to the data, the most sharks were recorded on:
According to the information in Table 1, what was the wind direction and wind speed during the feeding event that included the largest whale?
Based on Table 1, which wind direction had the highest total number of sharks?
According to the information in Figure 1, what is the maximum shark size for a wind speed of ~18 knots?
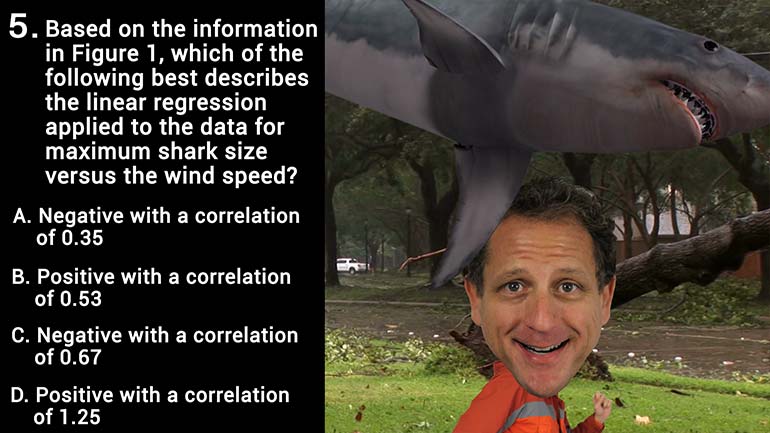
Based on the information in Figure 1, which of the following best describes the linear regression applied to the data for maximum shark size versus...
