ShmoopTube
Where Monty Python meets your 10th grade teacher.
Search Thousands of Shmoop Videos
Data Representation Videos 15 videos
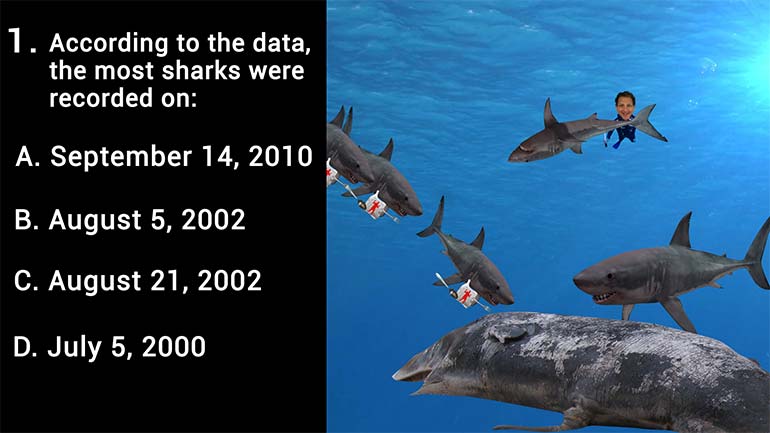
According to the data, the most sharks were recorded on:
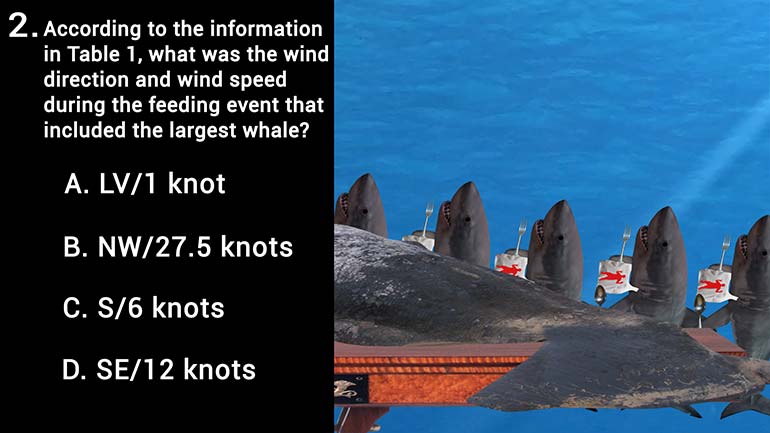
According to the information in Table 1, what was the wind direction and wind speed during the feeding event that included the largest whale?
Based on Table 1, which wind direction had the highest total number of sharks?
ACT Aspire Science: Scavenging Behavior of White Sharks 3 Views
Share It!
Description:
According to the data, the most sharks were recorded on:
Transcript
- 00:00
Yeah Oh Shar everybody out of the water So you're
- 00:14
not reading this while treading in the salty seas clients
- 00:17
They we are Everything's fine All right When we think
- 00:19
of sharks we might not think of them as scavengers
- 00:22
But in addition to hunting a great white shark also
Full Transcript
- 00:25
forages for meat One study here looked at how scavenging
- 00:29
affect the behavior of white sharks and their relation to
- 00:31
their physical surroundings For the study the team monitored white
- 00:35
sharks feeding off a dead whale carcass in False Bay
- 00:37
South Africa Study found that large sharks might be drawn
- 00:42
into the bay away from their migration routes by high
- 00:45
winds as these winds help the water transport the scent
- 00:48
of that you know dead whale And no this is
- 00:51
not an allegory for America's a congressional system So table
- 00:56
one below shows the recorder data from each scavenging event
- 00:59
in this study All right so we're gonna kind of
- 01:01
skin this thing and try to figure out what it's
- 01:03
all about Got whale species in size and wind direction
- 01:07
and speed and temp on probation Boy they really follow
- 01:10
things Figure one illustrates the relationship of wind speed Teo
- 01:15
Maximum Shark's eyes straight line and figure one is a
- 01:19
linear regression fit to the data points to illustrate a
- 01:21
direct relationship between wind speed and maximum shark sides Okay
- 01:27
so let's just get right down here The questions according
- 01:29
to the data that most sharks were recorded on the
- 01:33
wind So what We're going to look data here gets
- 01:37
the regression people where we look well The maximum number
- 01:41
of sharks observed in a scavenging event is forty That's
- 01:44
forty sharks You know we've been practicing our shark flipping
- 01:47
but we're pretty sure we don't stand a chance against
- 01:51
that many sharks Good thing these sharks have a much
- 01:53
taste your meal in front of them It's fatter than
- 01:55
we are The whale is still Each row of table
- 01:58
one represents data collected from one feeding event When a
- 02:02
bunch of sharks find a whale carcass and basically have
- 02:04
a dinner party for the feast with the most inter
- 02:08
guests can be found by looking at the column labeled
- 02:10
Max Number Sharks right there and just scanning for the
- 02:14
greatest number Not once we see that forty is greater
- 02:18
than all the rest Well we can check out its
- 02:20
date right there in the second column on the same
- 02:23
road So in the first row we see that forty
- 02:25
sharks were found circling a whale carcass on July fifth
- 02:28
two thousand A belated if Independence Day celebration Maybe Well
- 02:34
that's it The answer is deep What do you think
Related Videos
According to the information in Table 1, what was the wind direction and wind speed during the feeding event that included the largest whale?
Based on Table 1, which wind direction had the highest total number of sharks?
According to the information in Figure 1, what is the maximum shark size for a wind speed of ~18 knots?
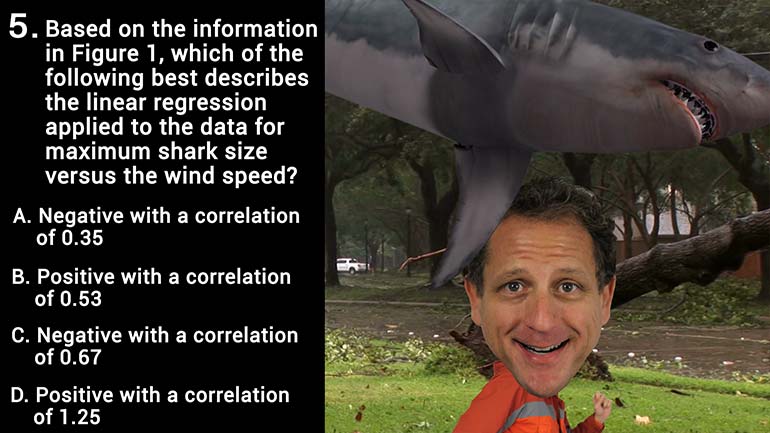
Based on the information in Figure 1, which of the following best describes the linear regression applied to the data for maximum shark size versus...
Based on the information in Figure 1, the Sharps Formation is located in which epoch?
