ShmoopTube
Where Monty Python meets your 10th grade teacher.
Search Thousands of Shmoop Videos
Playlist AP® Statistics 25 videos
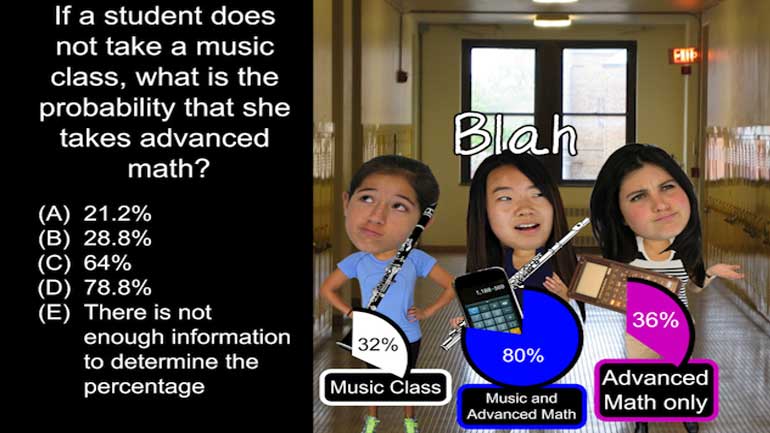
AP Statistics: Anticipating Patterns Drill 1, Problem 2. If a student does not take a music class, what is the probability that she takes adva...
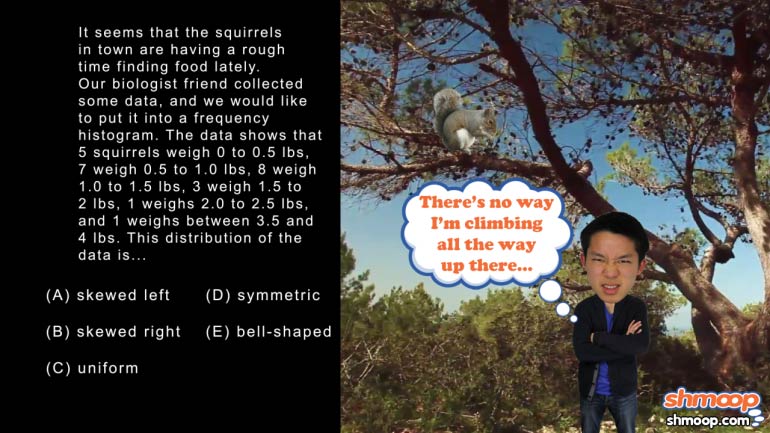
AP Statistics 1.1 Exploring Data. What should this histogram always be?
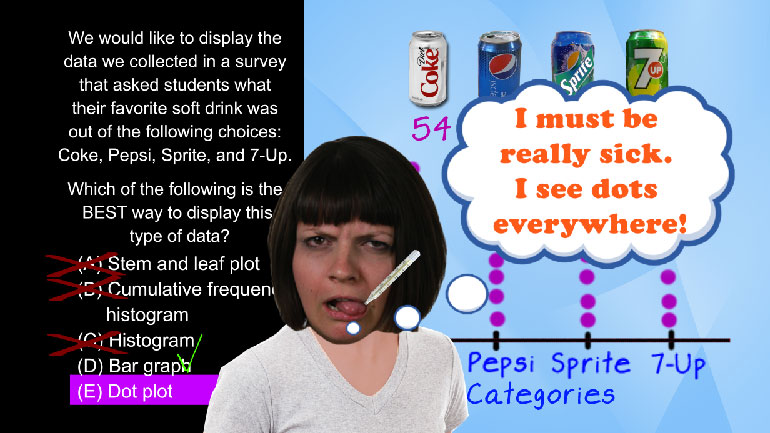
AP Statistics: Exploring Data Drill 1, Problem 2. Which of the following is the best way to display this type of data?
AP Statistics 1.1 Sampling and Experimentation 248 Views
Share It!
Description:
AP Statistics: Sampling and Experimentation Drill 1, Problem 1. Which of the following statements is true?
Transcript
- 00:03
Here's your shmoop du jour, brought to you by Polka Dots.
- 00:06
They're loud... but fortunately not as loud as polka itself.
- 00:10
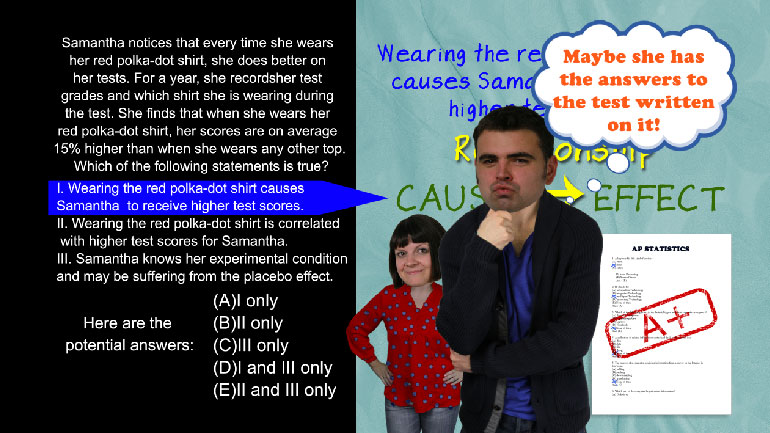
Samantha notices that every time she wears her red polka-dot shirt, she does better on her tests.
- 00:15
For a year, she records her test grades and which shirt she is wearing during the test.
- 00:20
She finds that when she wears her red polka-dot shirt, her scores are on average 15% higher
Full Transcript
- 00:26
than when she wears any other top. Which of the following statements is true?
- 00:31
And here are the potential answers...
- 00:35
So Samantha has conducted an experiment to try and figure out
- 00:38
whether her polka-dotted shirt is lucky or not.
- 00:41
She's noticed that her test scores are 15%
- 00:44
higher when she wears it... ...and we have to figure out which of the
- 00:47
three statements given are true.
- 00:50
The first one says that wearing the red polka-dot
- 00:52
shirt causes Samantha to receive higher test scores.
- 00:56
This implies a cause and effect relationship between her clothing and her test scores.
- 01:00
In other words, her shirt directly affects her scores.
- 01:03
This seems unlikely, as shirts are not generally known to affect testing capability...
- 01:08
Simply because Samantha's scores increase when she wears her red shirt doesn't mean
- 01:13
one causes the other.
- 01:15
Answer A just isn't true.
- 01:16
So we move onto the second statement, which
- 01:18
suggests correlation between the two events.
- 01:21
Correlation simply means that there is a connection between two events.
- 01:25
If Samantha wears her shirt, then her score increases 15%.
- 01:30
If..., then...This relationship suggests correlation...just
- 01:34
the fact that there IS a relationship.
- 01:36
Moving onto statement 3.
- 01:38
The simple fact that Samantha is aware of her experimental condition... means that she
- 01:42
could be inducing a bias in her test scores. If she believes that her red shirt helps her
- 01:48
do better, this psychological boost could be the real reason her scores increased by
- 01:52
15%. This unreal belief that causes a real effect
- 01:56
is called the placebo effect. So only statements 2 and 3 are right.
- 02:00
The answer is (E). So, unfortunately for Samantha's shirt, it
- 02:04
seems as if it may not be too responsible for all of her success.
- 02:08
Maybe they can still be friends.
Related Videos
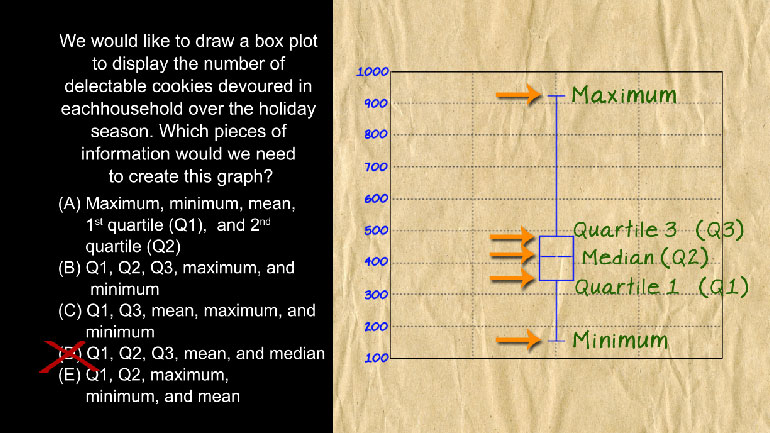
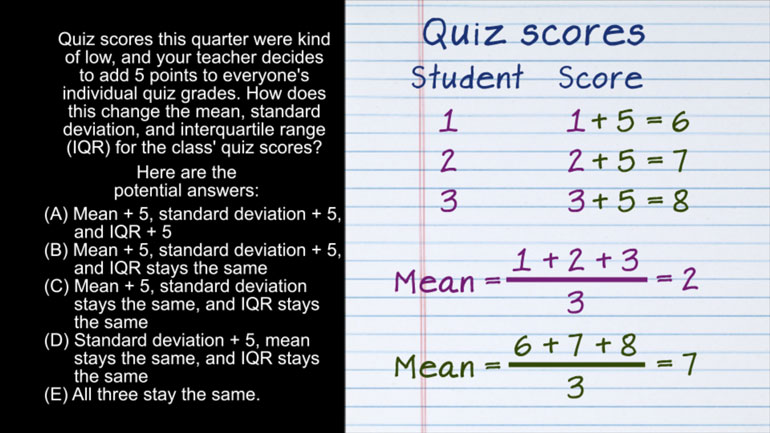
AP Statistics 2.1 Exploring Data. How does this change affect the mean, standard deviation, and IQR?
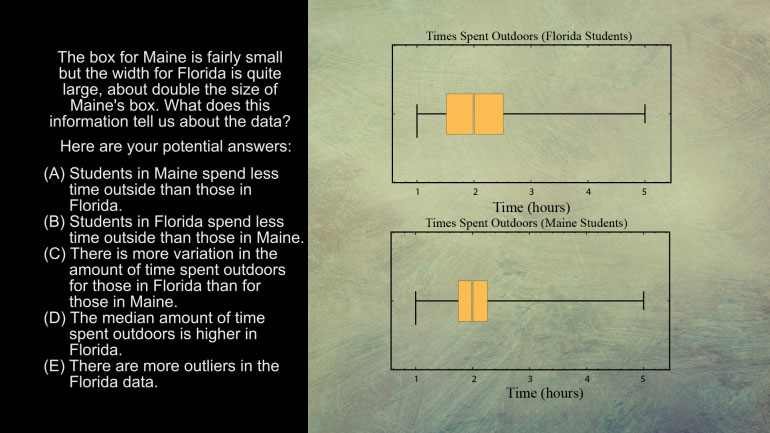
AP Statistics 5.1 Exploring Data. What does this information tell us about the data?
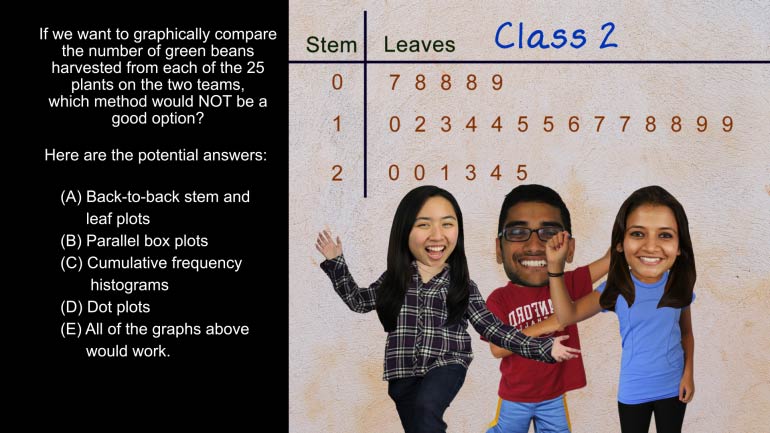
AP Statistics 5.2 Exploring Data. Which method would not be a good option?
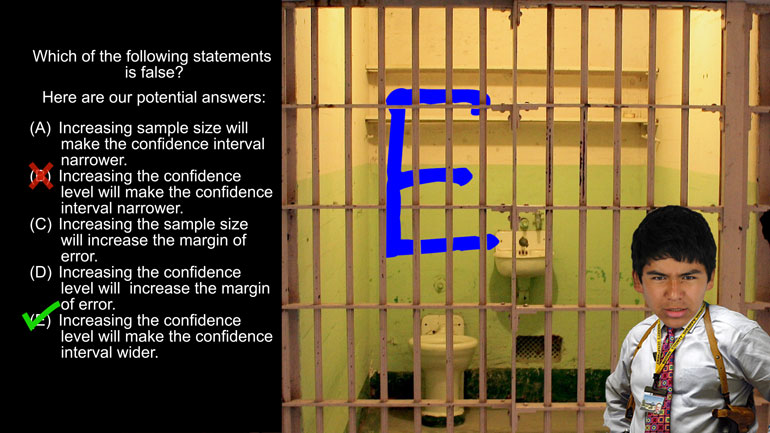
AP Statistics 1.5 Statistical Inference. Which of the following statements is false?
Want to pull an Oliver Twist and ask us for more? We've gotcha covered. Head over to /video/subjects/math/test-prep/ap-statistics/ for more AP...
