ShmoopTube
Where Monty Python meets your 10th grade teacher.
Search Thousands of Shmoop Videos
Charts, Graphs, and Tables Videos 60 videos
This video covers how to set up a stem and leaf plot and use it to find the mean and median of a set of numbers.
Knock-Knock. ¡Histograma cantante! Aquí para cantarte a tí acerca de toda la alegría y maravillas de lo que hacemos. ¿Te interesaría adquirir...
GED Math 5.1 Measurement 182 Views
Share It!
Description:
GED Math 5.1 Measurement. If one day's snow wasn't measured, which day would change the average the most?
Transcript
- 00:00
Thank you We sneak in and here's your shmoop du
- 00:05
jour brought to you by snow For once it didn't
- 00:08
flake on us Art alexander measured the amount of snow
- 00:14
that fell on his driveway each day last week His
- 00:17
results are shown in the following bar graph If he
Full Transcript
- 00:19
didn't count the measurement for one of these days which
- 00:22
day would change the average amount of snow that fell
- 00:24
over the entire week The most select the appropriate part
- 00:28
of the graph Okay so apparently alexander doesn't want cold
- 00:37
much firstly and we'd like to just blow the stuff
- 00:39
off the driveway and get the heck back inside Okay
- 00:43
we got a bar graph here showing how much snow
- 00:45
fell each day of the week The question is asking
- 00:47
which day if omitted would change the average the most
- 00:51
In other words which days snowfall was the furthest away
- 00:55
from the average which is the way that you have
- 00:58
got it All right Well right away we can eliminate
- 01:01
tuesday thursday and friday if one day is going to
- 01:03
skew our results it'd have to be either the day
- 01:06
with the most snowfall or the day with the least
- 01:09
snowfall well from here and we just kind of have
- 01:11
to do the math so let's get the average snowfall
- 01:14
first but we had six plus four plus three and
- 01:17
a half plus three plus two and a half which
- 01:20
equals nineteen then divide by five to get nineteen fists
- 01:23
or about three point eight All right well wednesday the
- 01:26
day with the least snowfall is a two point five
- 01:28
while monday is at six so wednesday was one point
- 01:32
three less than the average seems a little number line
- 01:35
You know that But monday was a whopping two point
- 01:38
two more than average meaning it would change our results
- 01:42
the most if we excluded it though for alexander having
- 01:45
a case of the mondays seems to take on a 00:01:47.688 --> [endTime] totally different meaning
Related Videos
GED Math: Graphs and Functions Drill 5, Problem 5. What is the value of a?
GED Math: Measurement Drill 1, Problem 1. The area, in square inches, of the shaded region where the two rectangles overlap is...what?
GED Math 1.1 Graphs and Functions. Which is the appropriate region of the coordinate plane?
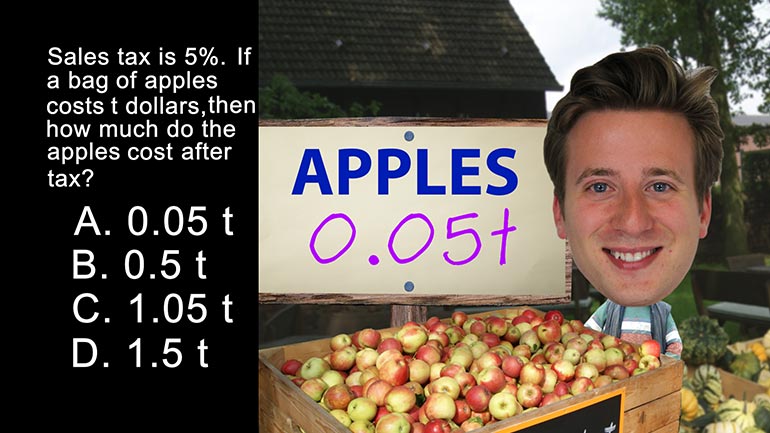
GED Math: Expression and Equations Drill 1, Problem 1. How much do the apples cost after tax?
