ShmoopTube
Where Monty Python meets your 10th grade teacher.
Search Thousands of Shmoop Videos
Biology Videos 42 videos
ACT Science: Data Representation Passage Drill 1, Problem 2. Which of the following is a variable in Figure 1, but not in Figure 2?
ACT Science: Conflicting Viewpoint Passage Drill 1, Problem 7. Which definition of the SAM is most likely to be agreed upon by both scientists?
ACT Science: Conflicting Viewpoint Passage Drill 1, Problem 10. According to Scientist 2, why do plant patterns come in waves or periods?
ACT Science 2.2 Data Representation Passage 246 Views
Share It!
Description:
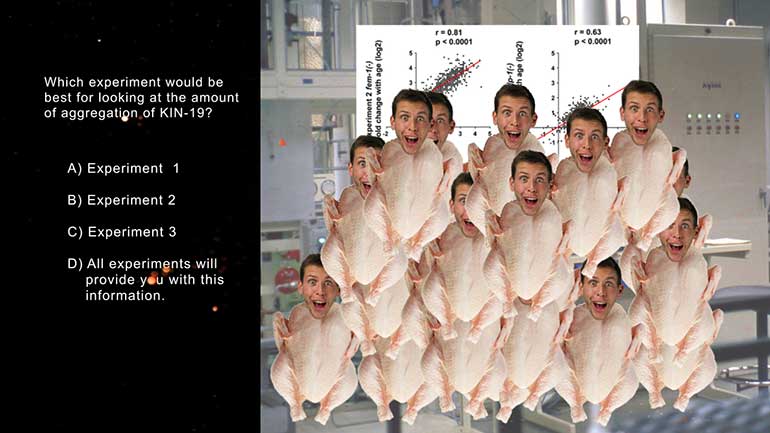
ACT Science: Data Representation Passage Drill 2, Problem 2. Compared to fem-1(-) worms, gon-2(-) worms will most likely have what?
Transcript
- 00:03
Here's your shmoop du jour: Brought to you by Joe's Bait and Tackle shop
- 00:08
They are the masters of bait!
- 00:36
Compared to fem-1(-) worms, gon-2(-) worms will most likely have:
- 00:41
And here are the potential answers:
- 00:46
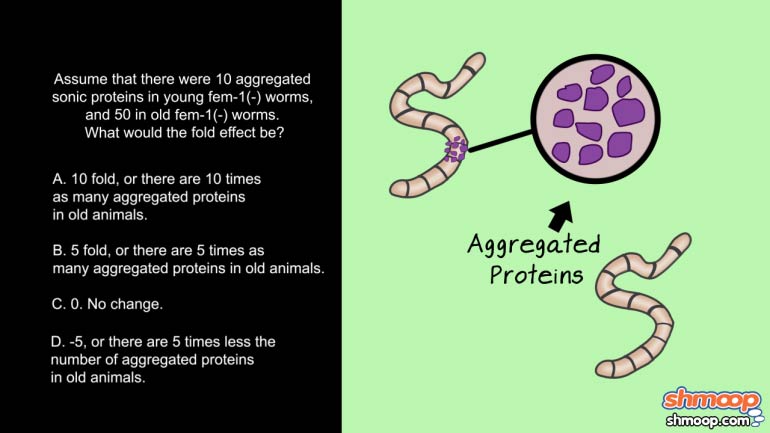
This question is asking us to compare fem 1 worms and gon 2 worms.
Full Transcript
- 00:52
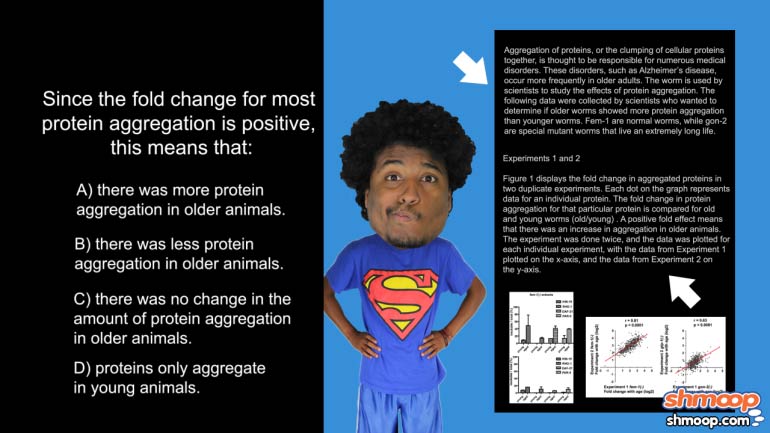
Our answer choices give us information about age-dependent protein aggregation, and Figure
- 00:57
1 shows us the fold change in protein aggregation between fem 1 and gon 2 worms.
- 01:03
So we know we should be looking at Figure 1 for our answer.
- 01:09
We notice that the fem -1 graph on the left has more data points associated with high
- 01:14
fold change than the gon -2 graph. This shows that on average, the amount of protein aggregation,
- 01:20
or fold change, is higher in fem -1 worms than it is in gon -2 worms.
- 01:30
So to answer the given question, gon-2 worms have LESS age-dependent protein aggregation.
- 01:35
Choice C is our answer!
Related Videos
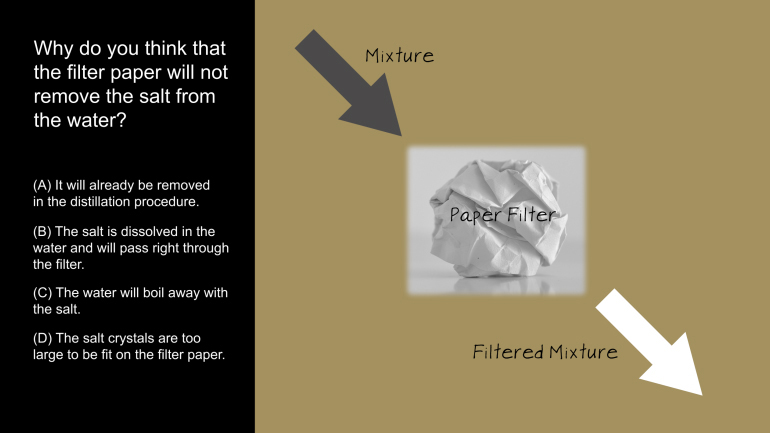
ACT Science: Research Summary Passage Drill 2, Problem 1. Why do you think that the filter paper will not remove the salt from the water?
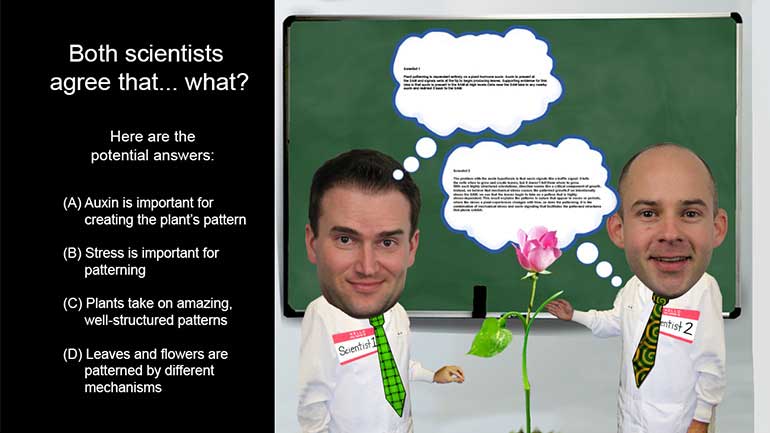
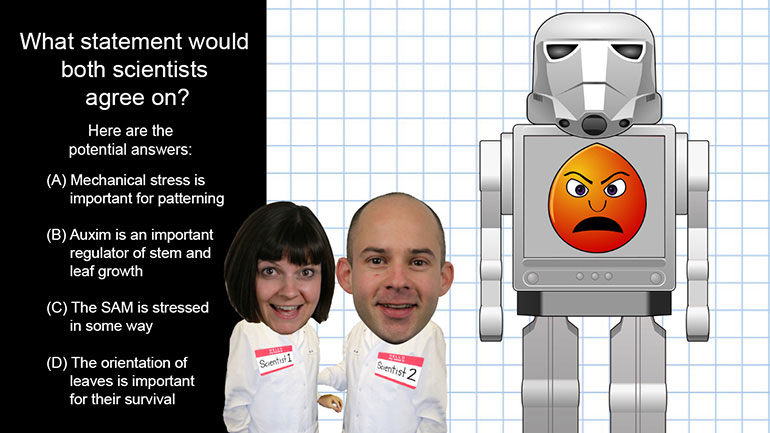
ACT Science: Conflicting Viewpoint Passage Drill 1, Problem 1. What statement would both scientists agree upon?
ACT Science: Data Representation Passage Drill 1, Problem 1. What do the statistics in Figure 1 suggest?
ACT Science: Data Representation Passage Drill 1, Problem 2. Which of the following is a variable in Figure 1, but not in Figure 2?
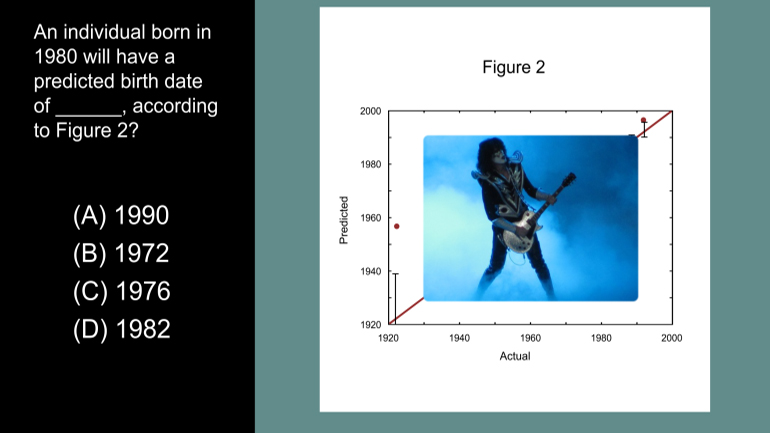
ACT Science Data Representation Passage: Drill 3, Problem 5. According to Figure 2, what birth date will be predicted for an individual actual...

