ShmoopTube
Where Monty Python meets your 10th grade teacher.
Search Thousands of Shmoop Videos
Biology Videos 42 videos
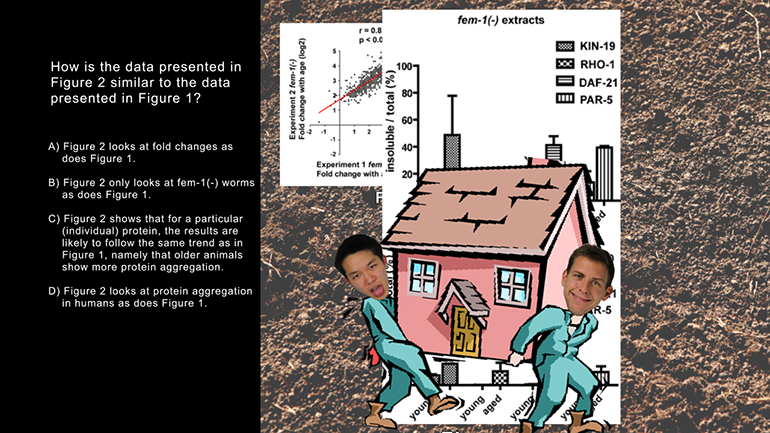
ACT Science: Data Representation Passage Drill 1, Problem 2. Which of the following is a variable in Figure 1, but not in Figure 2?
ACT Science: Conflicting Viewpoint Passage Drill 1, Problem 7. Which definition of the SAM is most likely to be agreed upon by both scientists?
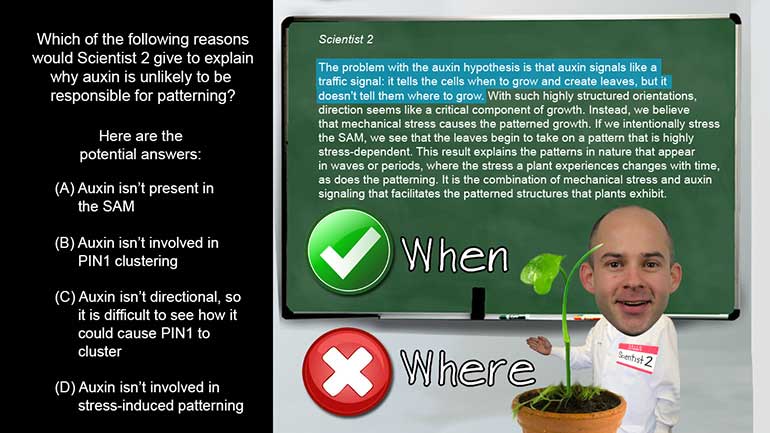
ACT Science: Conflicting Viewpoint Passage Drill 1, Problem 10. According to Scientist 2, why do plant patterns come in waves or periods?
ACT Science 3.4 Research Summary Passage 187 Views
Share It!
Description:
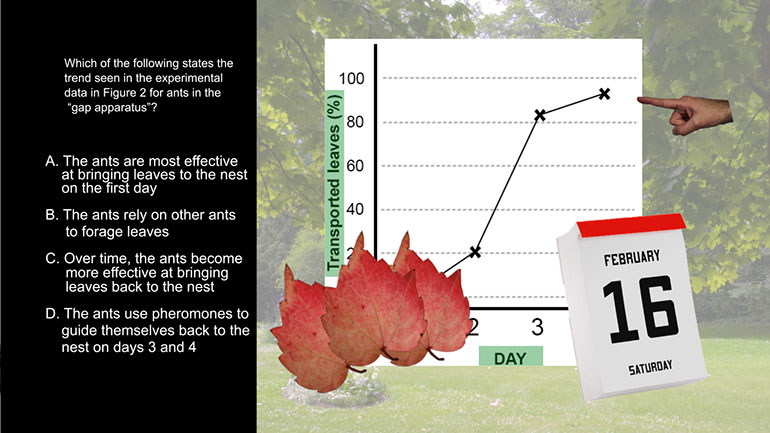
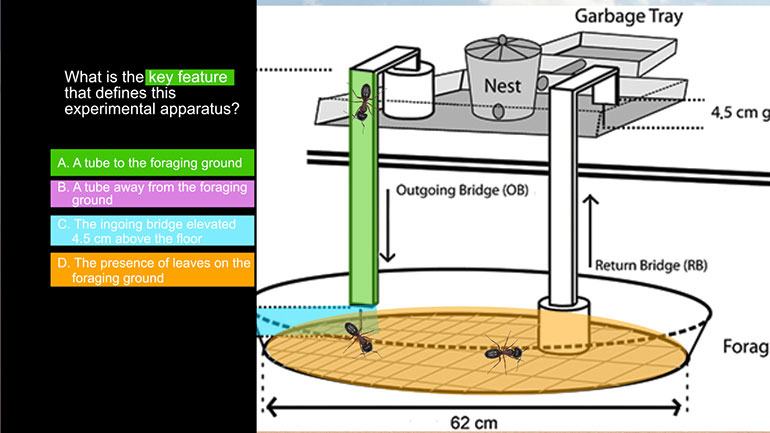
ACT Science: Research Summary Passage Drill 3, Problem 4. Which of the following states the trend seen in the experimental data in Figure 2 for ants in the "gap apparatus"?
Transcript
- 00:03
We just might have a problem... that you'd understand...
- 00:09
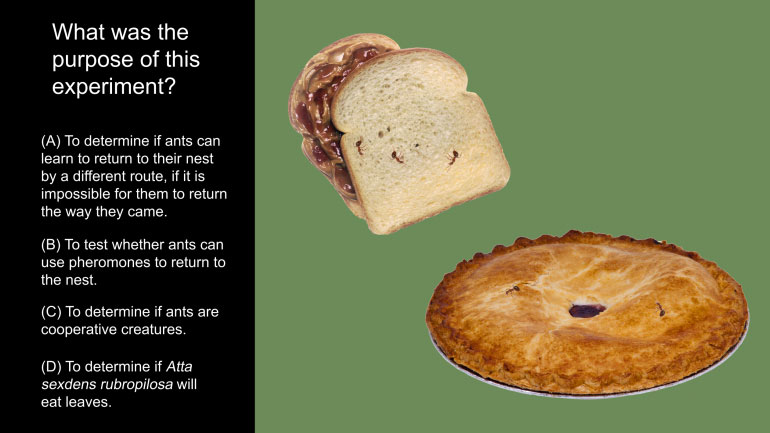
Here's a little experiment for you to try... hit pause and review this... experiment.
- 00:22
Which of the following states the trend seen in the experimental data
- 00:26
in Figure 2 for ants in the "gap apparatus"?
- 00:30
And here are the potential answers...
Full Transcript
- 00:35
Ok, so for this question, we have to use our knowledge about graphs.
- 00:39
First things first. The axis titles.
- 00:42
Titles are our best friends because they tell us exactly what the graph is about.
- 00:46
The x axis represents days, and the y axis represents the percentage of transported leaves.
- 00:53
So... our trend has to somehow relate to days and leaves.
- 00:57
That means we can cross off option B...since the graph doesn't say anything about lazy
- 01:01
ants who rely on others to forage leaves...
- 01:04
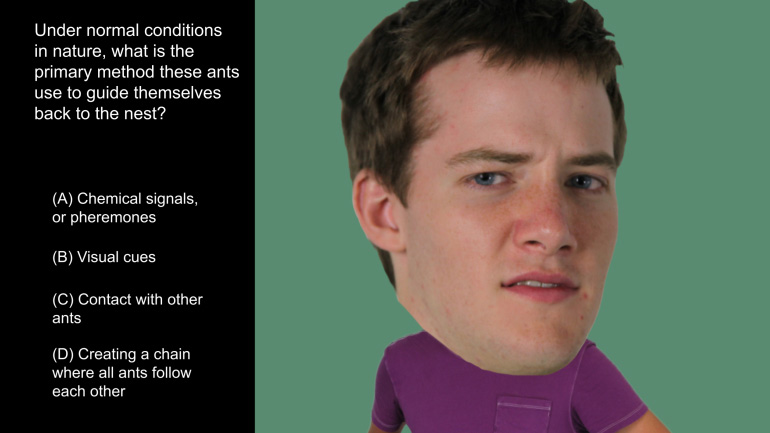
...and option D, which says that the ants use pheromones
- 01:07
to guide themselves back to the nest on day 3 and 4.
- 01:11
The ants may or may not use pheromones...but we don't care... not for this question, at least.
- 01:15
Right now, all we're concerned with is days and leaves.
- 01:19
Well, both options A and C are about days and leaves.
- 01:21
But...option A says that the ants are the most effective at bringing leaves to the nest
- 01:26
on the first day.
- 01:28
One look at the graph...and we can immediately cross off option A.
- 01:31
The ants were the least effective at carrying leaves on day 1.
- 01:35
They carried... nada. So option A is out.
- 01:39
Which leaves us only with option C.
- 01:40
The trend of the graph is that over time,
- 01:43
the ants become more effective at bringing leaves to the nest.
- 01:47
Guess this would be a leaf of absence.
Related Videos
ACT Science: Conflicting Viewpoint Passage Drill 1, Problem 1. What statement would both scientists agree upon?
ACT Science: Research Summary Passage Drill 2, Problem 1. Why do you think that the filter paper will not remove the salt from the water?
ACT Science Data Representation Passage: Drill 3, Problem 5. According to Figure 2, what birth date will be predicted for an individual actual...
ACT Science: Data Representation Passage Drill 1, Problem 2. Which of the following is a variable in Figure 1, but not in Figure 2?
ACT Science: Data Representation Passage Drill 1, Problem 1. What do the statistics in Figure 1 suggest?

