ShmoopTube
Where Monty Python meets your 10th grade teacher.
Search Thousands of Shmoop Videos
Statistics and Probability Videos 134 videos
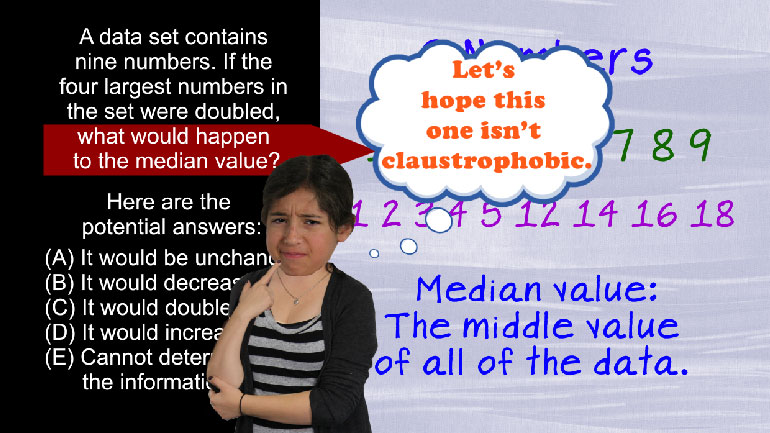
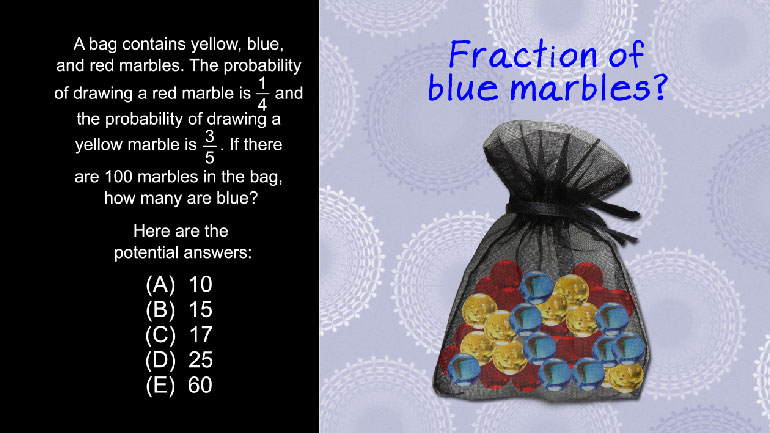
SAT Math: Statistics and Probability Drill 1, Problem 2. If the four largest numbers in the set were doubled, what would happen to the median...
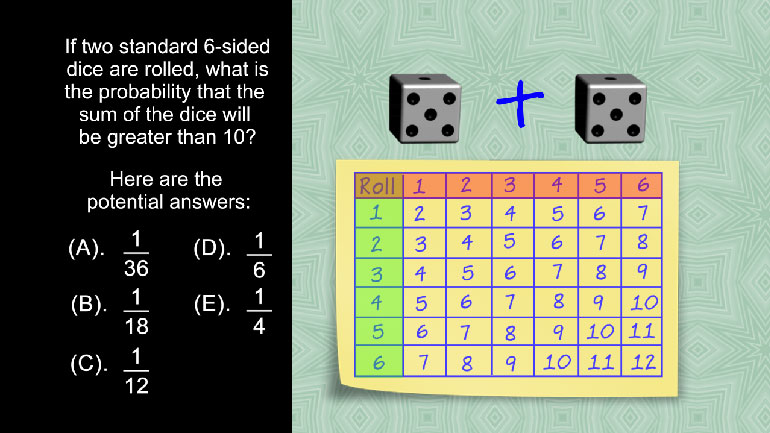
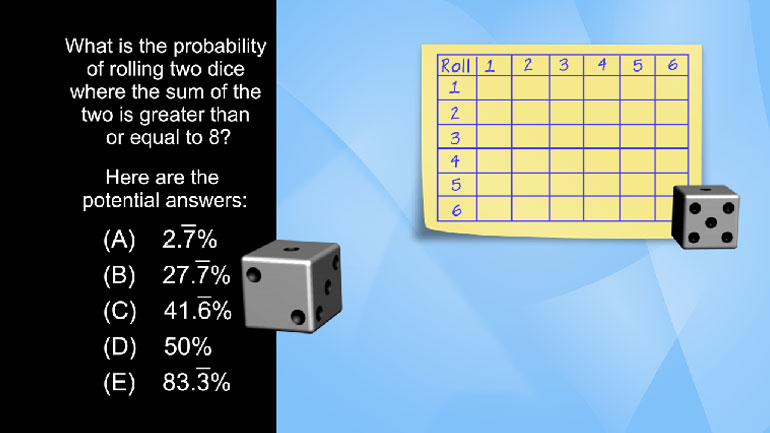
SAT Math 1.4 Statistics and Probability. If two standard 6-sided dice are rolled, what is the probability that the sum of the dice will be gre...
SAT Math 1.5 Statistics and Probability. If Silas draws one card, then places it in his pocket and draws another, what is the probability that...
CAHSEE Math 3.3 Statistics, Data, and Probability I 246 Views
Share It!
Description:
Statistics, Data, and Probability I: Drill Set 3, Problem 3. Which of the following tree diagrams represents all of a customer's possible choices for ordering a complete meal?
Transcript
- 00:03
Okay, let's get down to the shmoopy question...
- 00:06
To make a combo meal at a fast-food , restaurant, a person can order
- 00:10
two different kinds of chicken , sandwiches: grilled or crispy.
- 00:14
She can also order three kinds of sides: fries, onion rings or a mini-salad.
- 00:20
Finally, for drinks, she has a choice of cola, orange-flavored soda, lemonade, or root beer.
Full Transcript
- 00:26
Which of the following tree diagrams represents all of a customer's
- 00:30
possible choices for ordering a complete meal?
- 00:33
Here are the potential answers:
- 00:42
OK lottttts of real estate to cover here.
- 00:44
More than anything, this is a logic problem.
- 00:47
Let's suppose we've decided on a grilled chicken sandwich and a side of fries.
- 00:51
Now your only decision to make is what to drink. Sadly, Red Bull isn't an option.
- 00:57
You can choose from four drink options.
- 01:00
Okay, so there are 4 combos right there.
- 01:03
But say you have a potato allergy and want the side of onion rings instead.
- 01:07
You have the same 4 drink options, so that's 4 more combos.
- 01:11
And finally, if you're looking to cut calories, you could have gone with the mini-salad...
- 01:16
4 more combos. So basically, if you take your chicken grilled,
- 01:20
there are 12 combinations. If, on the other hand, you prefer a little
- 01:23
crunch with your cluck... ...you'll go through all the same steps
- 01:26
and come up with 12 more combinations... ...or 24 total.
- 01:30
So we need a tree that will represent all 24 of those combinations.
- 01:34
The correct tree should start off with two branches: one representing grilled chicken
- 01:40
and the other representing crispy chicken.
- 01:43
From each of these branches, there should
- 01:45
be three more for each of the sides, and then four more from each of THOSE for the drinks.
- 01:51
The only tree here that matches this description is the tree in (C).
- 01:55
Although, the question is a bit deceiving, as we all know chickens don't grow on trees.
Related Videos
Statistics, Data, and Probability I: Drill Set 3, Problem 4. How many different avatars can be created based on the given options?
CAHSEE Math: Algebra and Functions Drill 5, Problem 3. Solve the equation.
Statistics, Data, and Probability II Drill 3 Problem 2. Which two sports together make up for the preferences of more than half of all those w...
Statistics, Data, and Probability II Drill 3 Problem 3. One hundred twenty of those who were asked preferred what sport?
